
Balancing Vigilance with Optimism
The second quarter of 2025 was anything but quiet—marked by Liberation Day (and the quick policy reversal shortly thereafter), Moody’s downgrade of US debt to Aa1, and a flash point in the Middle East between Israel (and its ally the US) and Iran. Yet if we’d simply hibernated for three months, we would be waking up to global equity markets that were up over 11% for the quarter, resulting in a 10.1% return through the first half of the year—hardly the kind of “risk off” environment that would be anticipated in the midst of the aforementioned Q2 events. On the fixed income front, we now have a steeper—and slightly lower—yield curve. Additionally, as a reflection of general risk-taking appetites, credit spreads are essentially unchanged from where they began the year, which we have previously noted were well below historical averages. Real assets are more mixed. Real estate is up over 6% for the year, with most of the returns coming in Q2. Commodities in general are higher, with the Bloomberg Commodity Index returning over 5% YTD—but dispersion is wide: oil is down almost 10% YTD, while gold is up over 25%. As is usually the case, we are faced with an inconsistent and complex picture to evaluate as we make decisions on how to allocate our clients’ portfolios.
Encouragingly, having faced what could be considered peak uncertainty in early April, we are now starting to see some clarity—some good and some bad. Regardless of which, markets tend to favor degrees of certainty, even if they imply future challenges. In our last insights post, we highlighted the degree of uncertainty and argued that, if persistent, it could negatively impact companies’ willingness to invest in their future. While the chaos surrounding Liberation Day was swift and sudden, over the last 90 days, we have started to see economic policies take shape. The so-called “Big Beautiful Bill” has codified many of the 2017 tax cuts that were set to expire and introduced other relatively new components like the bonus depreciation allowance. We will dive into the deficit debate later, but in the short run, the more accommodative depreciation treatments have been shown—in the past—to stimulate corporate investment spending. Tariffs are still a major variable and will likely remain so as agreements are negotiated (and subsequently litigated in some cases) over the coming months. According to recent pieces by JP Morgan and Goldman Sachs, both anticipate tariff rates ending ~15% higher, with estimates ranging from -1% to -3% impact on earnings. Yet as earnings estimates decline, equity markets are rallying, forcing us back into territory that implies elevated valuations. As the chart below highlights, while we briefly touched “fair value” back during the height of the tariff tantrum surrounding Liberation Day, the forward multiple on the S&P 500 is back to being well above average.
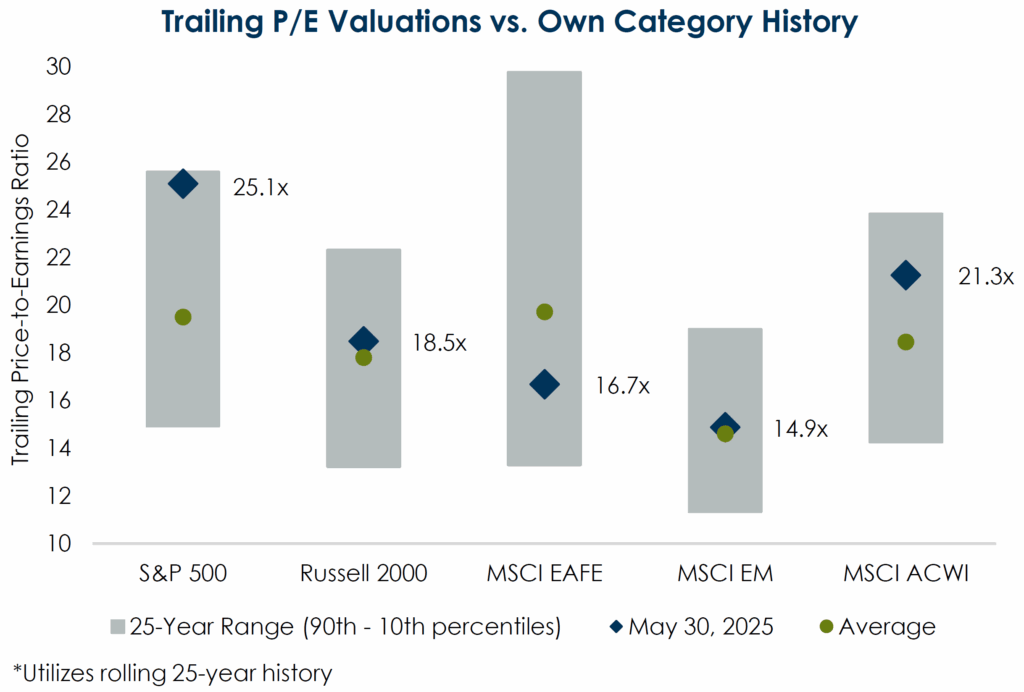
Recognizing that multi-national trade agreements are not formed overnight and likely have a litigious path to reality, progress is in fact being made, and companies will be willing to take some risks if they see the forming of a plan. Yet there is a second layer to this analysis. We believe that the improved clarity is certainly helpful, but how companies will react points to the challenge ahead. Liberty Street Economics summarizes survey results in the chart below, gauging the degree to which companies have been passing along additional tariff costs.
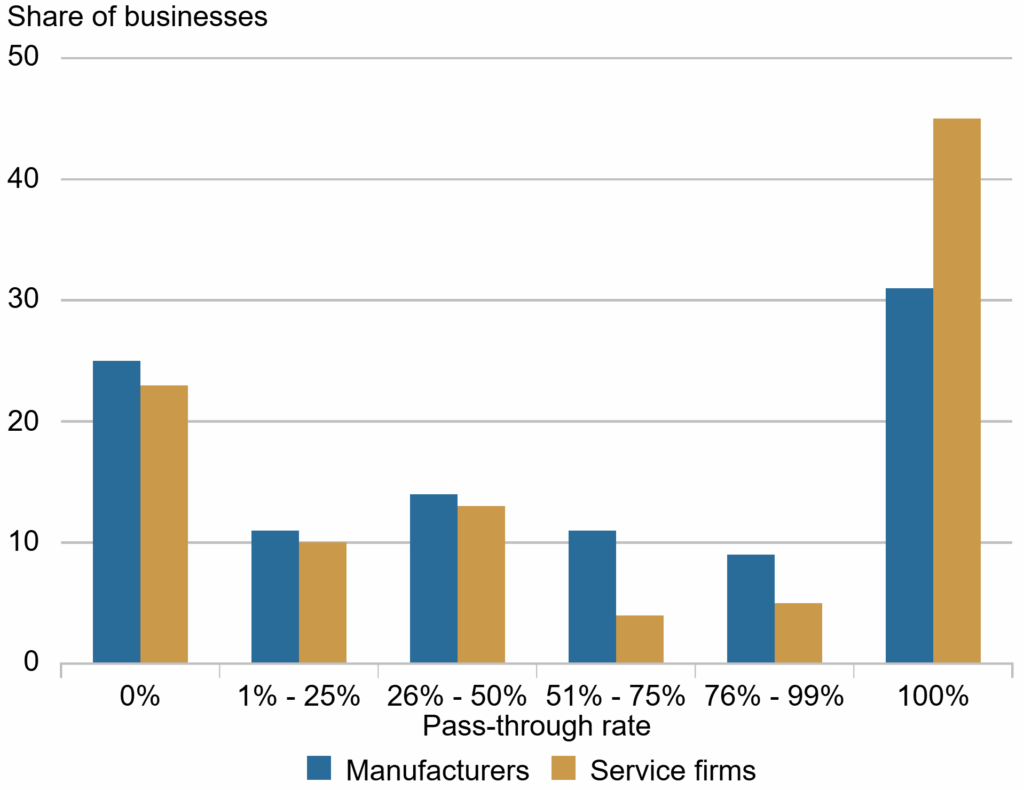
Most companies are planning on passing along at least a portion of the costs, with almost 1/3 of manufacturing firms suggesting they would pass through all the costs and almost 1/2 of all services businesses saying the same. The recent inflation release by the Bureau of Labor Statistics was mostly benign, contrasting progress being made with a few stubborn or volatile (oil) holdouts. These cost pressures will put stress on the system, which we believe can be positive in the long run—because it shines a light on good companies (and bad ones alike). In the short run, however, it doesn’t seem to sync up with elevated multiples, low spreads, and what appears to be general complacency1.
Diving into the Debt Debate
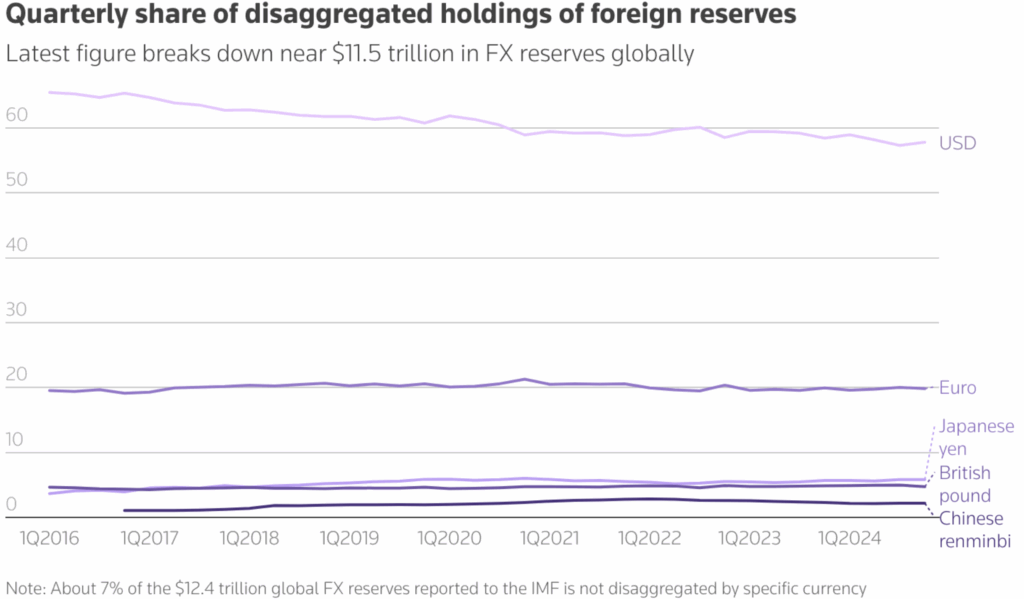
The passing of the Big Beautiful Bill has reignited the conversation surrounding the unsustainability of the current US deficit and debt trajectory. It is one of the most common questions we ask ourselves (and get asked by clients)—it is also one of the most complex answers to distill. To be fair, the decline in the US dollar year-to-date has been meaningful, and while we have concerns over the state of our longer-term fiscal responsibility (or lack thereof), the US dollar is still arguably the most critical cog in the global capital wheel. According to the Bank for International Settlements, the US dollar still settles approximately half of all international trade transactions. For context, this share has remained relatively stable over the last 20 years. There has been a gradual reduction in the % of foreign currency reserves held in US Dollars—though we’d emphasize the term gradual, as highlighted in the chart below from Reuters .
The question becomes—where are we going from here, should we be concerned, and if so, what steps should we take? We have compiled a few charts based on the Congressional Budget Office’s (CBO) most recent budget projections. It is important to note that these projections were prepared in January and, therefore, do not include the anticipated impacts of the recent tax bill.

The chart above shows the historical and projected interest expenses and total revenues for the Federal Government, with interest growing at a faster rate than revenues. That being said, the scale is a little misleading because our revenues are still multiples of our interest expenses. But this concept of proportionality is what leads us to the second part of our question—should we be concerned?
To answer this question, we evaluate the federal government in a manner similar to how an investor evaluates a business and their health as it relates to debt burden. One measure of corporate health is the interest coverage ratio, which is essentially the ratio of a company’s earnings (before interest and taxes) to its interest expenses. Generally speaking, the higher the ratio, the better, since it implies that a smaller proportion of the company’s earnings need to be allocated towards paying for their debts and can therefore be reinvested or distributed to owners/shareholders. There is no hard and fast rule for what constitutes a healthy vs. unhealthy coverage ratio, but a 2006 study by McKinsey & Co. made the case that investment grade borrowers should maintain an interest coverage ratio of 4.5x or higher. To be clear, the US government is not a business and therefore does not have traditional profit metrics, but a corollary used by ratings agencies like S&P to determine their sovereign debt ratings is the ratio of revenues to interest expense. The historical and projected ratio of federal revenues to interest expenses is illustrated in the chart below.
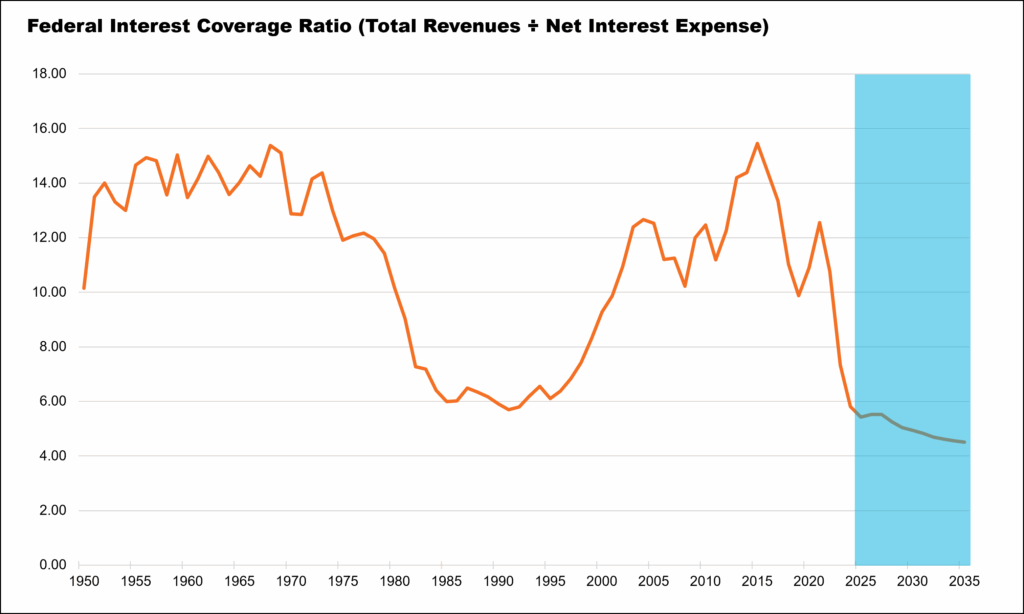
Based on the data above, we would conclude that current and projected ratios are still above the corporate guidelines, but trending in a direction that gives us less flexibility in the future to face exogenous shocks. In his memo from May 2024 titled “The Impact of Debt”, Howard Marks of Oaktree referenced work done by Morgan Housel and summed it up perfectly by saying that debt, in and of itself, is not a bad thing—but “as the level of one’s indebtedness increases, the range of volatility one can withstand narrows.” In other words, the cost of our increased debt load becomes the degree of resilience we have to manage through exogenous shocks. This was the lesson learned by the UK as post-WWII indebtedness and prolonged fiscal irresponsibility left them unable to combat the inflationary shocks of the 1970s, therefore requiring a bailout loan from the International Monetary Fund in 1976. In the decade that followed, the UK Pound Sterling declined by as much as 50% and the US dollar rose as the world’s preeminent reserve currency.
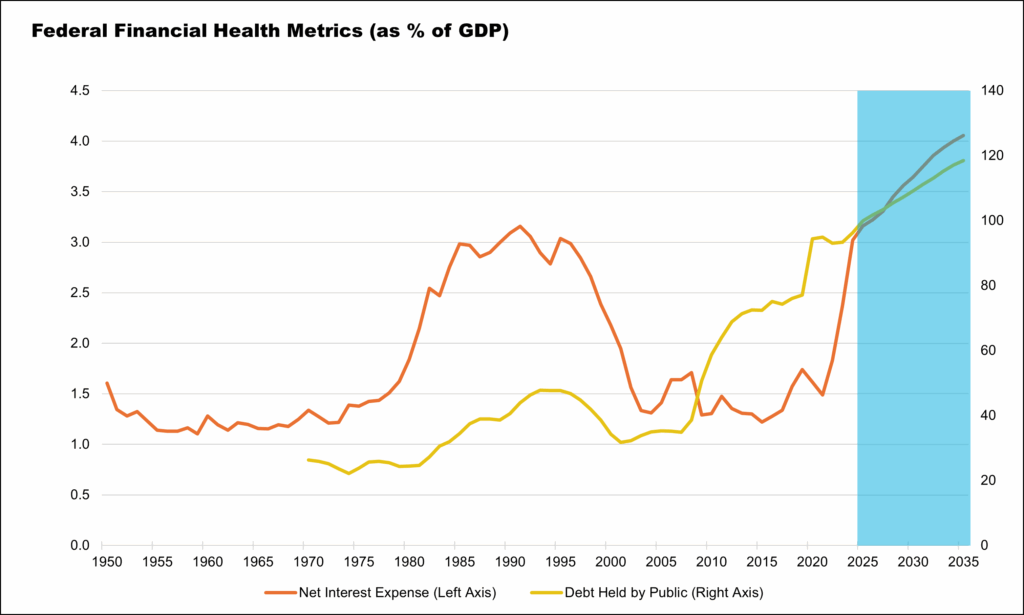
To be clear, we don’t believe the United States is condemned to a similar fate—as we saw in the mid-1990s, we have been here before when it comes to interest coverage ratios (chart above) and interest expense as % of GDP (chart below). Our trajectory is not irreversible, though it is going to take some growth, pragmatism, political capital, and, likely, time if we want to right the ship.
Which brings us to the last question—what steps should investors take in light of these risks? It’s important to reiterate that the US Treasury market remains the most liquid debt market in the world—and there is value and resilience inherent in that. But the risks are increasing, and we need to account for that possibility and evaluate potential diversification options.
Portfolio Implications
Fixed Income: Quality Matters
High yield spreads have narrowed YTD, though interestingly, spreads have widened among lower quality borrowers (CCC and below). We think bottom-up security work will be at a premium going forward. The private credit market has grown significantly over the last 5 years, as private lenders have taken a significant amount of market share from small and mid-sized banks. Spreads have narrowed and liquidity has improved, but like all credit markets, liquidity can dry up quickly, so one critical risk we consider is the degree to which the investment vehicle handles redemptions and what that implies for investor-level liquidity. We think the private markets provide a premium, but only if the illiquidity is appropriate in the portfolio. Recent economic data pointing to a stable, albeit slowing, economy coupled with moderating inflation, would lead us to believe that the Fed will have some room to ease in the second half of this year, and we think that the base expectation of two cuts remaining in 2025 is reasonable.
Equities: Expensive Once Again
We are once again on the expensive side of valuations for US large cap companies. As we highlighted in our private equity spotlight in March, the current forward earnings multiples on the S&P 500 imply below-average returns for the next decade. While we are long-term optimists on the dynamism of the US marketplace, we are comfortable using US Large Cap stocks as a source of liquidity when needed, given the value we believe we are receiving for them. Non-US stocks have also rebounded well this year, though mostly due to currency gains relative to the US dollar. Valuations outside the US are more attractive, and growth estimates are ticking higher. These companies will have to deliver on the optimism they are currently afforded, though we see upside there as real follow-through could result in a closing valuation gap between the US and its international counterparts. Private equity remains a strategic asset class for us and one where we believe manager alpha is available. As the chart below from Ropes and Gray illustrates, deal flow is nowhere near its highs several years ago, but deals are getting done—particularly at the larger end of the market.

The same macro factors apply to private companies as public companies, and valuations in private markets are also somewhat elevated. We do believe, however, that private ownership offers some unique value-creation opportunities, and we remain constructive on the asset class.
Real Estate: Prices Reflect Reality
We believe that real estate markets are fairly valued and are, consequently, looking at opportunities to generate competitive returns when compared to more expensive alternatives in equities and fixed income. In many ways, the real estate market is a contrast between the “haves” (industrials, data centers) and the “have-nots” (office, retail). While opportunities may still be available in some “have” markets and risks are abound in some of the “have-nots”, we are increasingly seeing some realistically attractive deals coming to our network of managers. Opportunistic strategies like Starwood and Oakwood, or more sector-focused managers like RSF and Phoenix, are projecting mid-teen IRRs with realistic underwriting assumptions. While not the subject of cocktail hour conversation, these are the proverbial singles and doubles that round out a balanced portfolio.
Conclusion
Our motto right now is balancing vigilance with optimism. We have concerns surrounding the complacency currently reflected in equity and (to a lesser extent) fixed income markets. Valuations across both markets are expensive, so discipline becomes our greatest asset. Discipline in this case means taking advantage of rebalancing opportunities to maintain policy allocations. It also means remaining intellectually curious and analytically rigorous, embracing the noise and keeping a close pulse on changing global dynamics. We must also make sure that any decisions we make are rooted in data and objectivity. Matter’s goal is to help our families create lasting and enduring legacies, grounded in purpose, values, and vision. An important component of that goal is to build flexible and resilient investment portfolios that allow us to achieve our long-term objectives, while adjusting for near-term needs and fluctuations.
1 Levels of complacency are being implied by evaluating current levels on the CBOE Volatility Index (VIX), CBOE SKEW Index, Put/Call Ratio on SPX , Put/Call Implied Volatility Skew and the St Louis Fed’s Financial Stress Index.
About Thierry J.D. Brunel
Thierry joined Matter in 2013, bringing years of experience in family office and wealth management. He previously worked in investment research and portfolio management roles at Convergent Wealth Advisors and GenSpring Family Office. At Matter, Thierry leads the investment committee, advising families on portfolio strategy and governance. A Wake Forest University graduate, Thierry has a diverse international background. He’s active in his community, serving as an assistant coach for the John Burroughs School Varsity football team in St. Louis.
Other Blogs by Thierry
This report is the work product of Matter Family Office. Unauthorized distribution of this material is strictly prohibited. The information in this report is deemed to be reliable but has not been independently verified. Some of the conclusions in this report are intended to be generalizations. The specific circumstances of an individual’s situation may require advice that is different from that reflected in this report. Furthermore, the advice reflected in this report is based on our opinion, and our opinion may change as new information becomes available. Nothing in this presentation should be construed as an offer to sell or a solicitation of an offer to buy any securities. You should read the prospectus or offering memo before making any investment. You are solely responsible for any decision to invest in a private offering. The investment recommendations contained in this document may not prove to be profitable, and the actual performance of any investment may not be as favorable as the expectations that are expressed in this document. There is no guarantee that the past performance of any investment will continue in the future.